How does it look when your database is starved from memory and runs into trouble?
Recently feldspaten moved to a ARM server and by doing so, I drastically reduced the amount of system resources. Previously I rented a dedicated root server, which was certainly overkill and I didn’t see the need for it anymore. Servers just got so powerful that renting the fraction of one is just enough for everything I need.
As part of the migration I also limited the resources for every system service. Most of them run as containers now, where this is trivial to achieve.
I use mostly postgresql and this service was also limited in it’s resources.
However it looks like I went a bit too low and this caused some operational interruptions in the last days, thanks to scrapers scraping my forgejo instance.
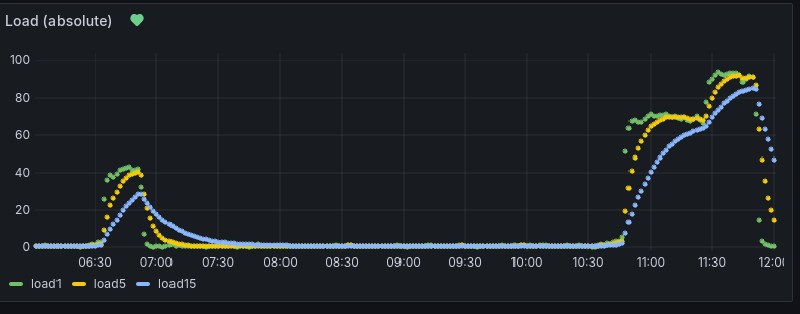
The database just got overwhelmed by the load of those bastards. And this is how it looks like when that happens in Grafana, after I increased the available memory again:
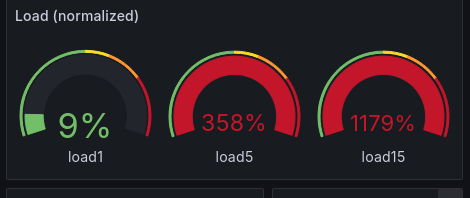

On the load gauges one can see, what difference it makes to give the postgresql database enough memory. The load1 is back to about 10%, while load5 and load15 still need to “calm down”. In the timeseries graph one can see the large peak in system load once the database run into trouble. And after increasing the shared_buffers from 32 to 512 MB and restarting the database.
The load gauge immediately dropped after restarting the database with more memory. And now it (hopefully) stays low. This is how the load peak looks in the monitoring system:
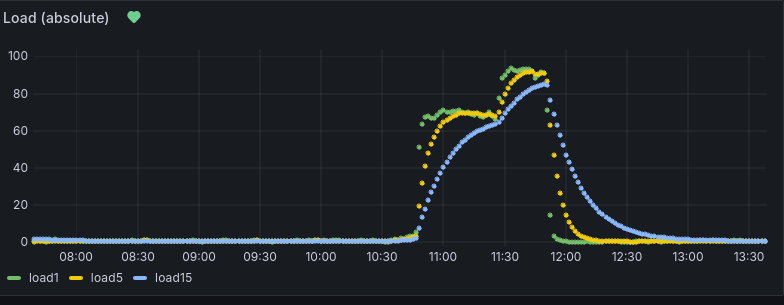
This graph just shows the same as above but at a later time, so that one can see the full peak and how the server settled down again.
Lessons learned
Monitor your systems. That saves you from deeper trouble. And always have backups.
I could react on time and prevent this little incident of becoming a problem. The fix was simple and luckily I caught it on time, before the database went completely haywire.
This issue could also have been prevented by allocating enough resources from the start, but that’s against the exercise I’m right now doing right now. The intention is to reduce the resources needed, and reducing the memory for postgresql is part of the game. But I had monitoring in place and was prepared for some “migration pain” or issues like this to occur. The fix was easy and in the end I have now a better tuned system and a better understanding of how much resources I really need. Plus the the resource usage is still low. Maybe not minimal, but low. I consider this a good thing for the planet 🌍🙂.
Throwing resources at the problem is certainly a way of preventing issues of this kind in the first place. But it’s also wasteful. And one doesn’t learn how much resources you actually need to run your services. I’m not saying that approach is wrong, it really depends on your goals and use case. Mine is to be more resource friendly, and resource tuning is just part of the journey to minimal power and resource usage.
For me in particular: 512MB of shared buffers appears to be more than enough for a not-too-busy postgresql server that serves multiple services like synapse or forgejo (and some smaller ones). And, given nowadays hardware, I will not use less than 128MB of shared buffers in the future anymore for postgresql.
Also, once again: monitor your systems. That can save you from deeper trouble.
And always have backups.