
Quicklink to my tool (GitHub).
Yesterday I started to work on my Infragram camera that I bought some years ago from Adafruit. I never got it really running and at some point I just put it away. Until yesterday.
Infragram by Public Labs is a citizen science project that allows you to visualize plant health. It is based on a multi-spectral satellite imaging technique from NASA - the NDVI analysis.
In simple words: It takes the near infrared and the visible light spectrum and runs some (pretty simple) math on them. We come to that in a second.
Although infragram.org provides a online analysis tool, I found that pretty much unsatisfactory. At the end of the day I want to run those things on my own devices. Since I couldn’t find useful tools, at some point I decided to write my own.
Luckily there is enough documentation on the Infragram Wiki, that I was able to do that.
Let’s start with the basics.
NDVI analysis
The informations of this section are based on the NDVI wiki page on Public Lab. NDVI stands for “Normalized Difference Vegetation Index” and is a technique that monitors how much photosynthesis is happening.
See the example picture, taken from https://publiclab.org/wiki/ndvi
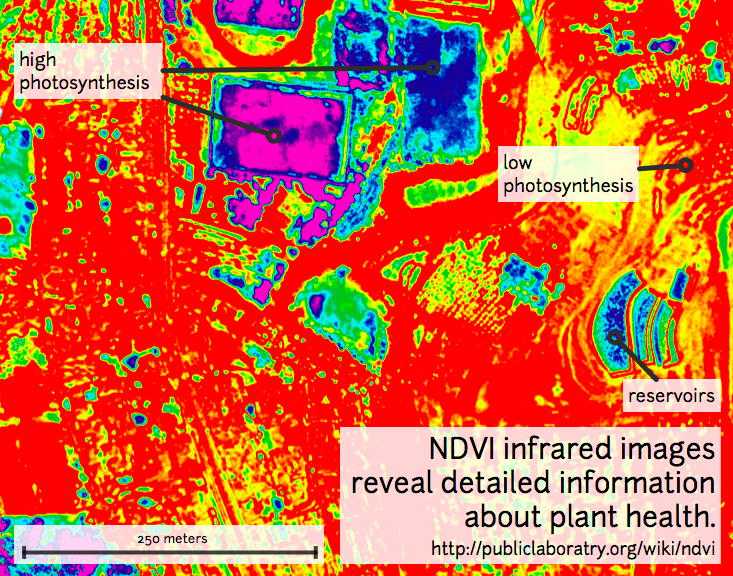
In a nutshell: NDVI is a technique to monitor the photosynthesis by differentiating between infrared and visible light pictures. The math behind it is pretty simple

The output is a value between -1 and 1, where higher values indicate high photosynthesis happening.
Of course, this is only valid for light being reflected by plants, reflective surfaces like lakes or the sky do not match the assumption.
The following picture shows a example output of the NDVI technique
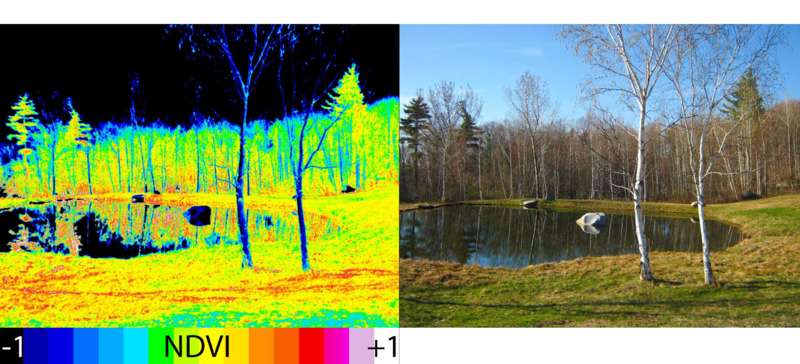
Example picture of the NDVI technique]
Infragram Tool
Since I couldn’t find any native tool that directly supports Infragram on Linux, I decided to write my own tool. The aim was a easy-to-use zero-knowledge tool to just start. At the end of the day all I want to do, is to connect the Infragram camera to my laptop/raspberry pi/NanoPi Neo or whatever and take NDVI pictures. So I designed it to work in the following way
./infragram NDVI.jpeg                               # Take a picture and write it to NDVI.jpeg
./infragram -i /dev/video1 NDVI.jpeg CAMERA.jpeg    # specify input and camera output picture
Results
I wrote the tool and played a little bit around with it
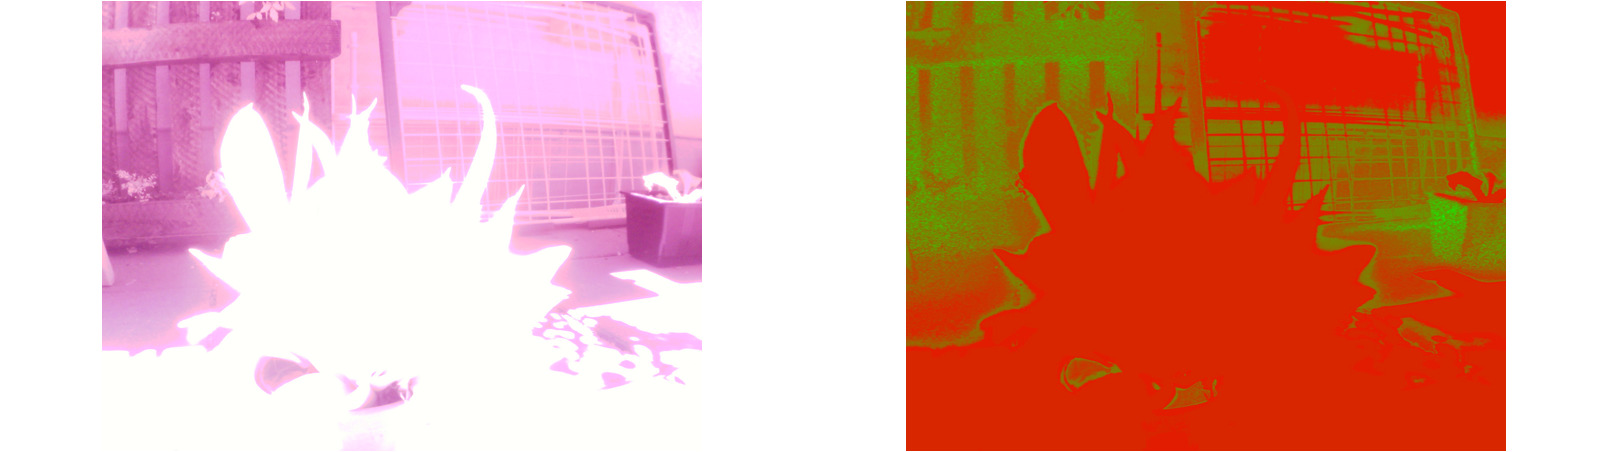 First picture in daylight. Left: Camera, Right: NDVI
In the daylight, the camera is wayyyy over-saturated. The resulting picture is not really meaningful. So let’s take the plant indoors, where it still gets indirect sunlight.
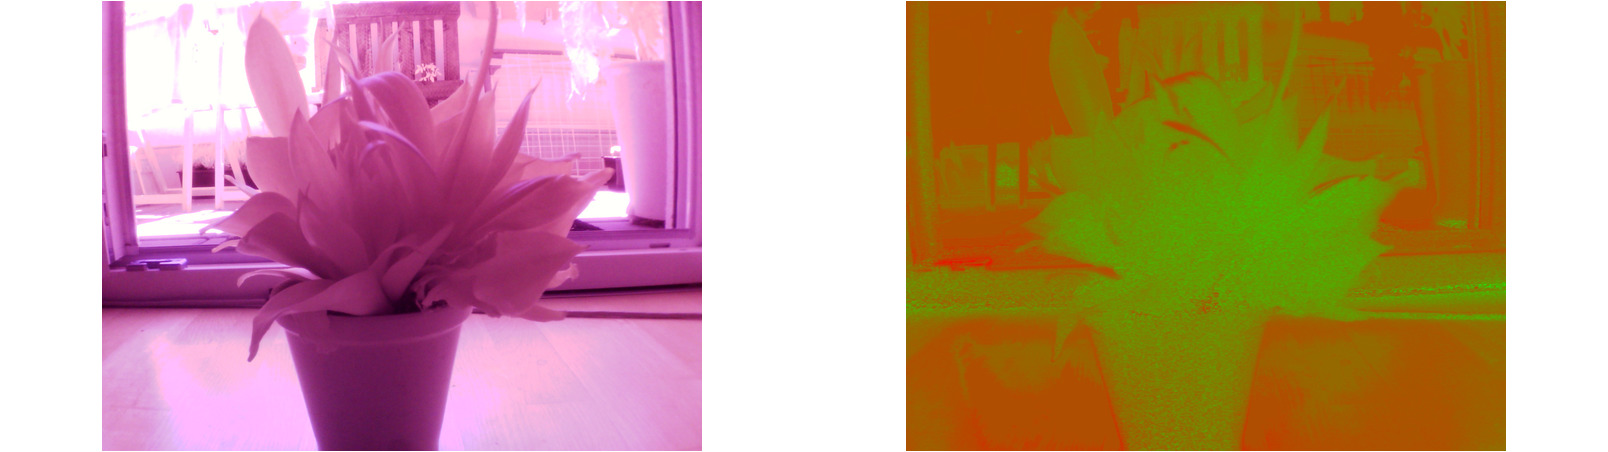 Left: Camera, Right: ndvi
Ok, looks already pretty good! The chosen colormap is not really good, that’s something I have to work on. Now, let’s see if the output is actually reflecting how good the plant is in health. I put a piece of paper in front of the plant to cover the IR emitted light.
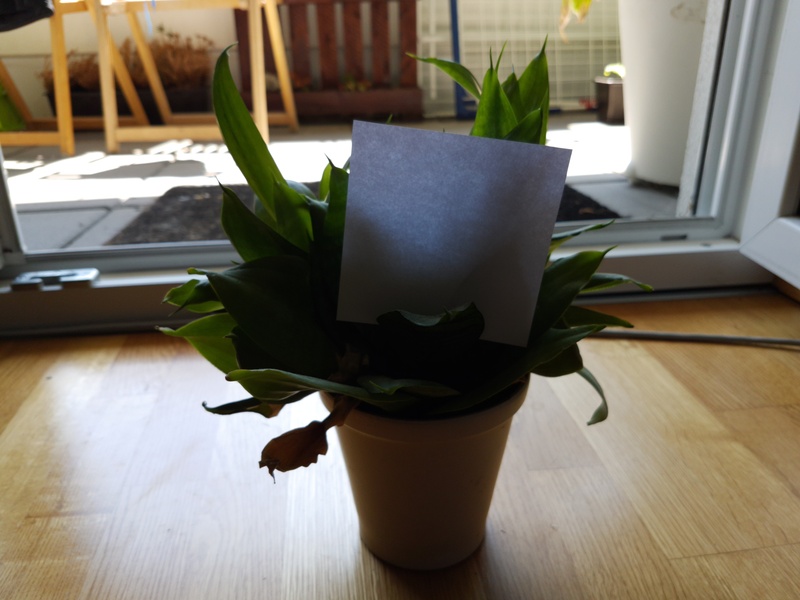
I’m covering the observed plant with a piece of paper to have a look at the NDVI technique. The paper should be clearly visible as non-healthy part of the plant.
So, how does it look in the end?
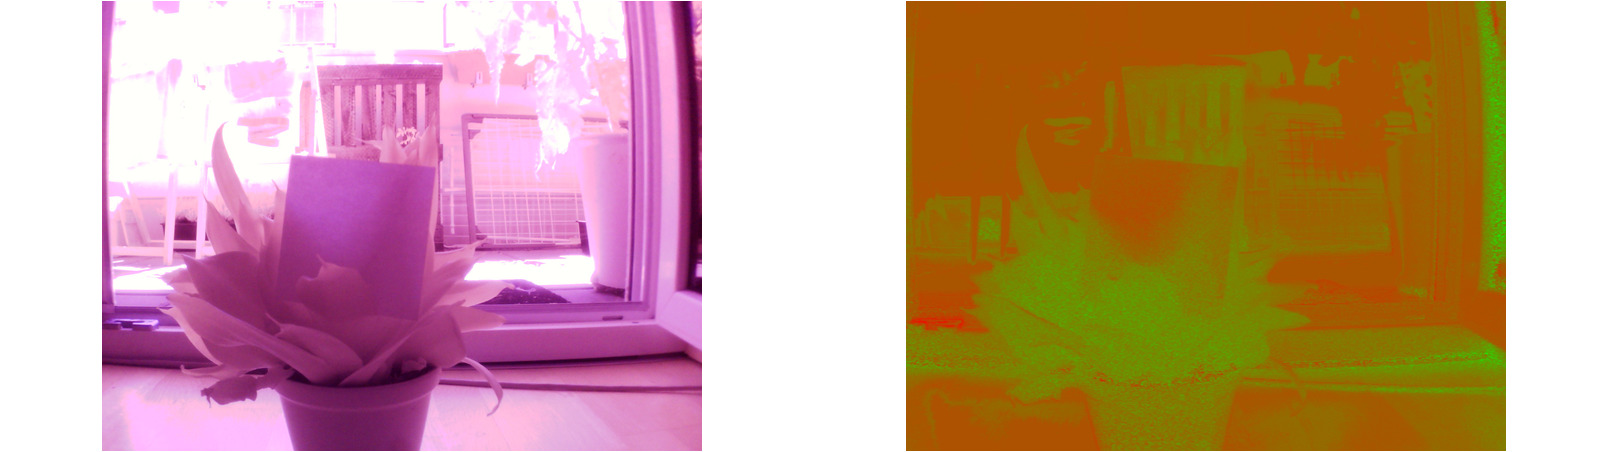
Plant with piece of paper to cover IR light. Left: Camera, Right: NDVI
Ok, I can see the piece of paper but on the places where the leaves are pretty close the IR emission seems to penetrate. This is actually a good sign, because it reflects the nature of the IR emission. Next, I want to try how it looks if I thicken the paper
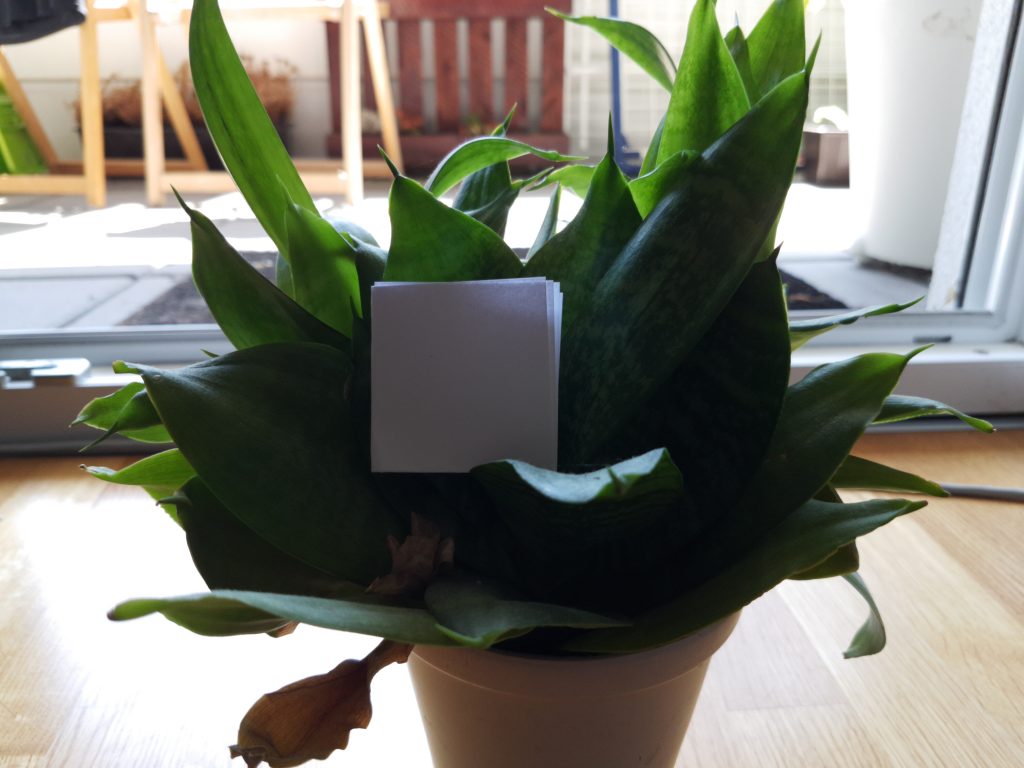
With the folded paper as emission blocker, let’s have a look at the picture of the Infragram camera
Two pieces of paper, folded two times in front of the plant. Left: Camera, Right: NDVI
Hmm, I still can see the paper, but the expected behaviour (sharpt edges and cut-out paper) did not happen. Maybe the paper itself is a good in IR emission of the scattered ambient light. I don’t know for sure, but yet, the results are OK for the first tries.
I now have a working prototype that runs on my Laptop and can start to further dig deeper into the topic. At least that’s something very nice! 🙂
Further work
The provided tool is a working prototype, but the colormap and the NDVI technique are not yet fully utilized. As of now, this might be a good starting point for some other people, but the software is not yet as mature as it can be used for anything but playing around.
Weblinks
- https://github.com/grisu48/Infragram
- https://infragram.org
- https://publiclab.org/wiki/infragram
- https://www.adafruit.com/product/1722 (Discontinued Adafruit Product)